
The 2018 AMA Gold Top 50 Report
2018 marks the 45th year of the publication of the AMA Gold Top 50 Report of U.S. market research and analytics companies
Jack Honomichl, who in 1974 was the research beat reporter for Advertising Age, first published the Top 10 Report of U.S. Research Companies in Advertising Age.
The industry and this report have changed and grown substantially in 45 years, but there are many long-established and respected research institutions (some whose names have changed) included in this report that reflect the tradition as well as the transformation of our storied industry.
The total research revenue for the top 50 companies in 2017 was $24.08 billion. More than 46% of that revenue, $11.24 billion, was generated in the U.S. while more than 53%, $12.83 billion, was generated outside the country.
The total market research industry, represented by the top 50 and 148 full-service companies comprised by the Insights Association (the national association of the marketing research and analytics industry, which was formed through the 2017 merger of Council of American Survey Research Organizations (CASRO) and Marketing Research Organization (MRA)), is valued at a total worldwide revenue of $25.55 billion ($12.34 billion of which was earned in the U.S. and $13.20 billion of which was earned outside the country).
In early 2018, invitations to participate in the annual top 50 ranking of U.S. research companies were sent to about 75 companies whose annual U.S. revenue was estimated to be about $15 million. These companies were asked to submit their 2017 research revenue figures for inside and outside the U.S., as well as the comparable data for 2016, to determine the annual rate of revenue growth or decline of each. If a firm made an acquisition or divestiture during 2017 or 2016, we made adjustments to ensure an apples-to-apples comparison.
U.S. Growth Rate in 2017
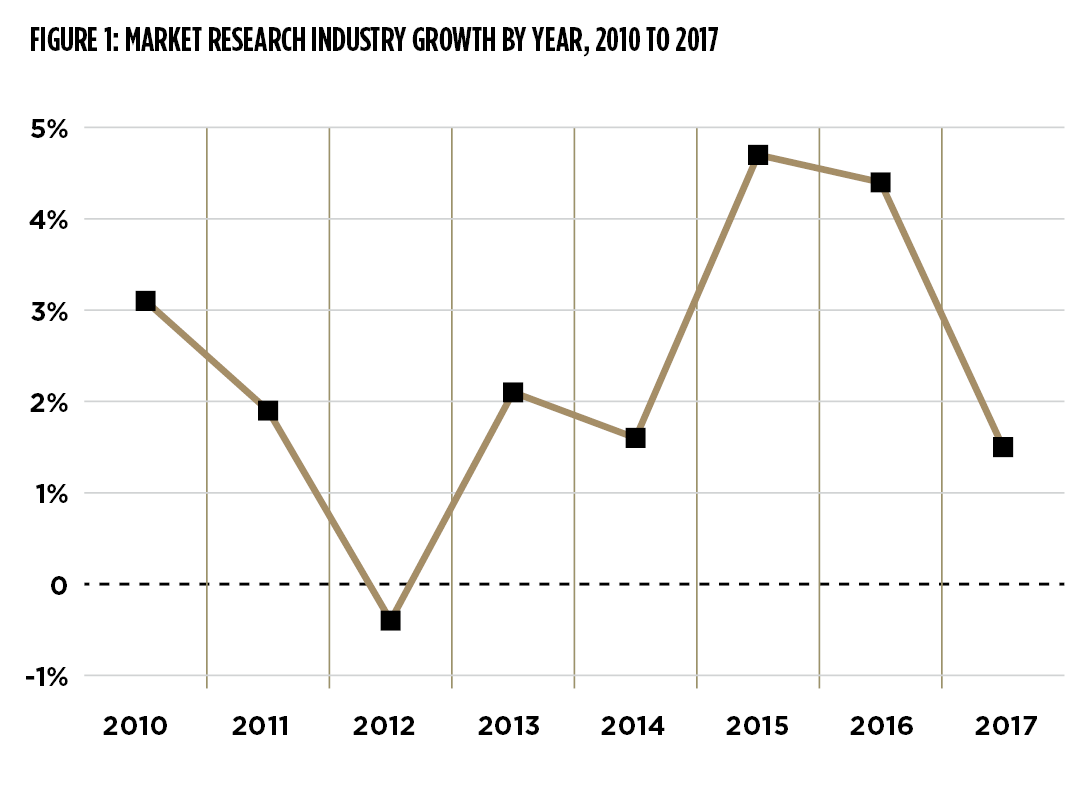
The growth rate for the top 50 companies in the U.S. market in 2017 was 3.4%.
The growth rate for the 198 companies included in the report was 3.5%. After adjustment for inflation—Consumer Price Index (CPI) of 2%—the real-growth rate for 2017 is 1.5%. This is a substantial decrease in growth as compared to the previous two years, when the growth rate reported for all of the companies included in the report was 5.7% (4.4% real growth) in 2016 and 4.8% (4.7% real growth) in 2015.
Figure 1 compares the reports from 2010 to 2017, showing the slow and intermittent recovery from the recession, followed in 2015 and 2016 by a significant increase of more than 4% in the industry’s real-growth rate.
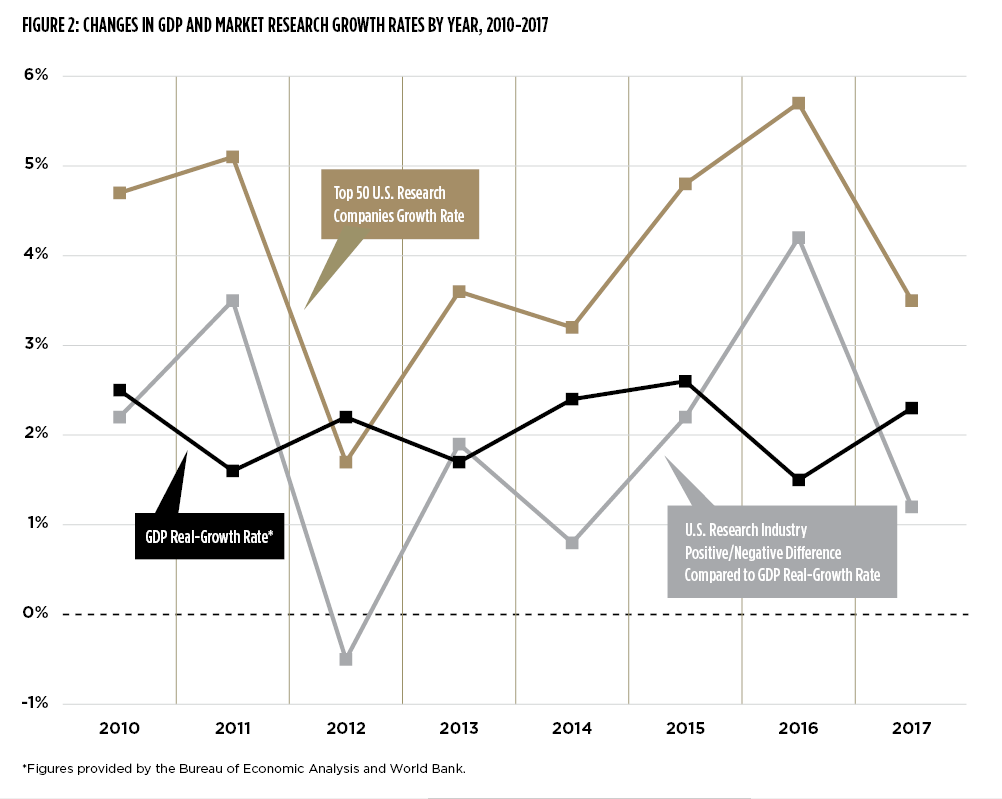
We can also look to the U.S. gross domestic product as another benchmark. In Figure 2, the annual U.S. GDP shows the yearly growth of the estimated value of all the country’s produced goods and provided services. As previously reported, the U.S. research industry’s annual growth rate has historically tracked ahead of the annual GDP real-growth rate, except during the recession of 2009 and in 2012. The U.S. research industry’s growth rate exceeded the GDP growth rate by 2% in 2015 and in 2016 doubled that figure to 4%. In 2017 the U.S. research industry is tracking slightly ahead of GDP at 1.2%.
Global Growth Rate in 2017
The growth rate of the top 50 companies’ global revenue in 2017 was 3.7%, slightly higher than the 3.4% growth rate for U.S. revenue. The total non-U.S. revenue for the top 50 companies continues to be greater than their total U.S. revenue. In Figure 3, the non-U.S. revenue for the top 50 companies represents 53.3% of the total 2017 revenue. One significant reason for this global focus is that almost one-fourth of the top 50 companies are headquartered in other countries. Seven are headquartered in the U.K.—Cello Health, dunnhumby, Informa Financial Intelligence, Kantar, Nielsen, Wood MacKenzie and YouGov—and two are headquartered in France—Ipsos and PRS IN VIVO. GfK is headquartered in Germany. Macromill is headquartered in Japan, and Maru/Matchbox is headquartered in Canada.

It is interesting to note that almost 20% of the top 50 companies are not engaged in any international research, although this number has decreased since 2010.
The Employment Picture
In 2017 the number of full-time U.S. employees working for the top 50 companies was 38,890, an increase of 5.8% from the previous year. The U.S. average revenue earned per full-time employee in 2017 was $287,000.
Changes in Top 50 List
New This Year
There are five new companies on the list.
- At No. 7, comScore rejoins the top 50 after not participating last year. ComScore is a global, multiple-platform measurement company that specializes in media planning, audience measurement and segmentation and competitive intelligence.
- At No. 11, Forrester Research Services is the research and analytics division of Forrester, a global research and advisory firm that works with business and technology leaders to develop customer-centric strategies that drive growth.
- At No. 31, FocusVision is a survey research, reporting and analytics company that also provides live video, digital qualitative research and research technology solutions to U.S. and global clients.
- At No. 41, ScreenEngine/ASI is a market research and information company that specializes in and serves the entertainment industry, focusing across the four screens: movies, television, computers and mobile.
- At No. 47, Edelman Intelligence is a boutique and global research and analytics consultancy that helps organizations and businesses measure markets, environment and audience to improve impact and outcomes.
Not Here This Year
There are five former top 50 companies that are not on the list this year. Abt Associates, MarketCast, Service Management Group and Simmons Research chose not to participate in the report this year. Acturus was acquired by Macromill.

2017 Top 50 Revenue Increases and Decreases
Figure 4 compares U.S. revenue increases and decreases for the top 50 companies for the past three years.
In 2017, one-fifth of the companies reported double-digit increases in year-over-year revenue, with an average increase of 18.6%. Of the companies that experienced double-digit growth, three achieved 20% or more year-over-year growth in 2017.
- SSRS, a social science, public opinion and policy research company, recorded a 33.2% increase.
- Edelman Intelligence, a global research and analytics consultancy, grew by 28.1%.
- YouGov, an international data and analytics company, increased its 2017 revenue by 21.6%.
Nearly half of the top 50 companies reported that revenue was flat or decreased in 2017, averaging a 4.7% drop. One-third of the top 50 companies reported single-digit increases in year-over-year revenue, averaging 5.5% growth. The number of companies with single-digit increases has remained stable over the past three years. The greatest swing, particularly from 2016 to 2017, has been the decline of double-digit increases in year-over-year revenue and the corresponding rise in companies whose year-over-year revenue decreased in 2017.
Moving Up
Companies Moving Up Three or More Positions:
- Cello Health plc (up eight positions from No. 42 to No. 34) combines health insight, consulting, communications and digital capabilities.
- SSRS (up six positions from No. 39 to No. 33) is a social science, public opinion, and policy research company.
- Informa Financial Intelligence (up five positions from No. 22 to No. 17) is a research, analysis and intelligence company for the financial industry.
- Macromill (up four positions from No. 29 to No. 25) is a global provider of online panel research and market and consumer insights.
- YouGov (up three positions from No. 27 to No. 24) is a national and international data and analytics company.
- Gongos (up three positions from No. 45 to No. 42) is a decision intelligence and customer experience company.
The Top 10
The addition of comScore to the top 10 and the absence of Abt Associates change the composition of this year’s top 10, and the lineup has changed slightly.
Three companies moved down one position to accommodate comScore’s No. 7 position in the top 10:
- At No. 8, GfK, which leads the list with the largest percentage of non-U.S. revenue at almost 82%, provides market research, data science, technology and knowledge to support business clients around the globe.
- At No. 9, The NPD Group combines its information assets, analytic solutions focused on market forecasting and expertise in more than 20 industries to help clients measure, predict and improve.
- At No. 10, ICF is a global consulting services provider with 5,000 professionals designing and implementing complex research projects for national and international government agencies, universities, nonprofits and commercial organizations.


The top six companies have maintained their positions in the lineup.
- At No. 6, Westat is a 100% employee-owned professional services firm providing statistical, behavioral, employment and social policy research as well as evidence-based evaluations and solutions for government agencies, foundations and commercial businesses.
- At No. 5, Ipsos provides strategic research, digital platforms, Big Data analytics and advisory services. Ipsos in the U.S. has centers of expertise in data science, neurosciences and behavioral sciences at Duke University, Yale University, Massachusetts Institute of Technology and Stanford University.
- At No. 4, IRI’s five key areas of expertise are market performance and strategy; consumer and shopper intelligence; media; analytics and retail execution; and data management, cloud and software solutions.
- At No. 3, Kantar, WPP’s data investment management division, has nine operating brands, each respected in its particular sphere of expertise: Kantar Consulting, Kantar Health, Kantar IMRB, Kantar Media, Kantar Millward Brown, Kantar Public, Kantar TNS, Kantar WorldPanel and Lightspeed.
- At No. 2, IQVIA, formed through the 2016 merger of Quintiles and IMS Health, is a global provider of information, innovative technology solutions and contract research services helping health care clients find better solutions for patients.
- At No. 1, Nielsen is a global media and consumer measurement company, utilizing technology and digital capabilities and platforms to develop a comprehensive understanding of what consumers watch and what they buy.
The top 10 companies’ total 2017 revenue of $20.37 billion represents nearly 80% of the total 2017 revenue for all 198 companies included in this year’s report. Nielsen accounts for 25% of the total 2017 revenue for all of the 198 companies. The top 10 companies represent 73.5% ($9.07 billion) of the total U.S. revenue and 85.6% ($11.30 billion) of the total non-U.S. revenue for all of the 198 companies in this year’s report.
Methodology
Invitations to marketing research firms with estimated revenue greater than $15 million are sent in February of each year requesting revenue information for the prior calendar year, and for the year preceding to assess the growth rate. Other company data are also requested, including a description of the company’s management, services, specializations, etc. Top 50 rankings are based on U.S. revenue. The rate of growth from year to year has been adjusted to account for revenue gains or losses from acquisitions or divestitures. Verification of revenue is required of each private firm for ranking by a third party, generally it’s an outside accounting firm.
The Insights Association and AMA have been working cooperatively with Michigan State University’s Research Transformed Collaborative under the leadership of Michael Brereton, adjunct professor at the Broad School of Business at MSU. We owe a special thank you to Brereton and Michigan State University for their support and for providing the Qualtrics platform for hosting the Top 50 questionnaire. We will continue to collaborate with our national and international association colleagues, especially the other national research associations in the Global Research Business Network (GRBN), as well as with ESOMAR.
For further information, contact Diane Bowers at diane.bowers@insightsassociation.org.
<<<<<<<<<<<<<<<<<<<<<<<<<<DOWNLOAD THE FULL REPORT>>>>>>>>>>>>>>>>>>>>>>>>>>
1. Nielsen
- Founded: 1923
- 2017 U.S. Revenue: $3.73 billion
- Percent Change from 2016: +2.9%
- 2017 Non-U.S. Revenue: $2.84 billion
- Percent from Outside U.S.: 43.2%
- 2017 Worldwide Revenue: $6.57 billion
- U.S. Employees: 10,149
2. IQVIA†
- Founded: 2016
- 2017 U.S. Revenue: $1.43 billion
- Percent Change from 2016: +5.3%
- 2017 Non-U.S. Revenue: $2.03 billion
- Percent from Outside U.S.: 58.7%
- 2017 Worldwide Revenue: $3.46 billion
- U.S. Employees: 5,525
3. Kantar†
- Founded: 1993
- 2017 U.S. Revenue: $970 million
- Percent Change from 2016: -2.4%
- 2017 Non-U.S. Revenue: $3.02 billion
- Percent from Outside U.S.: 75.7%
- 2017 Worldwide Revenue: $3.99 billion
- U.S. Employees: 3,300
4. Information Resources, Inc. (IRI)
- Founded: 1979
- 2017 U.S. Revenue: $733.4 million
- Percent Change from 2016: +14.7%
- 2017 Non-U.S. Revenue: $416 million
- Percent from Outside U.S.: 36.2%
- 2017 Worldwide Revenue: $1.14 billion
- U.S. Employees: 1,746
5. Ipsos
- Founded: 1975
- 2017 U.S. Revenue: $569 million
- Percent Change from 2016: +0.2%
- 2017 Non-U.S. Revenue: $1.4 billion
- Percent from Outside U.S.: 71.2%
- 2017 Worldwide Revenue: $1.97 billion
- U.S. Employees: 2,191
6. Westat
- Founded: 1963
- 2017 U.S. Revenue: $551.1 million
- Percent Change from 2016: +10.1%
- 2017 Non-U.S. Revenue: $6.4 million
- Percent from Outside U.S.: 1.1%
- 2017 Worldwide Revenue: $557.5 million
- U.S. Employees: 1,877
7. comScore
- Founded: 1999
- 2017 U.S. Revenue: $332.3 million
- Percent Change from 2016: +4.9%
- 2017 Non-U.S. Revenue: $71.2 million
- Percent from Outside U.S.: 17.7%
- 2017 Worldwide Revenue: $403.5 million
- U.S. Employees: 1,478
8. GfK†
- Founded: 1934
- 2017 U.S. Revenue: $300 million
- Percent Change from 2016: -3.3%
- 2017 Non-U.S. Revenue: $1.35 billion
- Percent from Outside U.S.: 81.8%
- 2017 Worldwide Revenue: $1.65 billion
- U.S. Employees: 890
- Founded: 1966
- 2017 U.S. Revenue: $289.4 million
- Percent Change from 2016: +11.7%
- 2017 Non-U.S. Revenue: $93 million
- Percent from Outside U.S.: 24.3%
- 2017 Worldwide Revenue: $382.4 million
- U.S. Employees: 1,100
10. ICF
- Founded: 1969
- 2017 U.S. Revenue: $170.6 million
- Percent Change from 2016: +4.2%
- 2017 Non-U.S. Revenue: $57.9 million
- Percent from Outside U.S.: 25.3%
- 2017 Worldwide Revenue: $228.5 million
- U.S. Employees: 1,028
11. Forrester Research Services†
- Founded: 1983
- 2017 U.S. Revenue: $166.7 million
- Percent Change from 2016: +0.1%
- 2017 Non-U.S. Revenue: $49.8 million
- Percent from Outside U.S.: 23%
- 2017 Worldwide Revenue: $216.5 million
- U.S. Employees: 400
12. Wood Mackenzie†
- Founded: 1973
- 2017 U.S. Revenue: $132.7 million
- Percent Change from 2016: —
- 2017 Non-U.S. Revenue: $312 million
- Percent from Outside U.S.: 70.2%
- 2017 Worldwide Revenue: $444.7 million
- U.S. Employees: 300
13. DRG (Decision Resources Group)†
- Founded: 1990
- 2017 U.S. Revenue: $129.5 million
- Percent Change from 2016: +1.2%
- 2017 Non-U.S. Revenue: $51.3 million
- Percent from Outside U.S.: 28.4%
- 2017 Worldwide Revenue: $180.8 million
- U.S. Employees: 560
14. MaritzCX
- Founded: 1973
- 2017 U.S. Revenue: $124.4 million
- Percent Change from 2016: -3.2%
- 2017 Non-U.S. Revenue: $42.9 million
- Percent from Outside U.S.: 25.6%
- 2017 Worldwide Revenue: $167.3 million
- U.S. Employees: 574
15. Lieberman Research Worldwide (LRW)
- Founded: 1973
- 2017 U.S. Revenue: $107.8 million
- Percent Change from 2016: +16.8%
- 2017 Non-U.S. Revenue: $40.1 million
- Percent from Outside U.S.: 27.1%
- 2017 Worldwide Revenue: $147.9 million
- U.S. Employees: 534
16. dunnhumby†
- Founded: 2001
- 2017 U.S. Revenue: $103 million
- Percent Change from 2016: -3.7%
- 2017 Non-U.S. Revenue: $355 million
- Percent from Outside U.S.: 77.5%
- 2017 Worldwide Revenue: $458 million
- U.S. Employees: 230
17. Informa Financial Intelligence*
- Founded: 2016
- 2017 U.S. Revenue: $102.4 million
- Percent Change from 2016: -1.3%
- 2017 Non-U.S. Revenue: $34 million
- Percent from Outside U.S.: 24.9%
- 2017 Worldwide Revenue: $136.4 million
- U.S. Employees: 484
18. NRC Health
- Founded: 1981
- 2017 U.S. Revenue: $99.6 million
- Percent Change from 2016: +9.3%
- 2017 Non-U.S. Revenue: $4.7 million
- Percent from Outside U.S.: 4.5%
- 2017 Worldwide Revenue: $104.3 million
- U.S. Employees: 413
19. C Space†
- Founded: 1999
- 2017 U.S. Revenue: $67.6 million
- Percent Change from 2016: +1.5%
- 2017 Non-U.S. Revenue: $17.8 million
- Percent from Outside U.S.: 20.8%
- 2017 Worldwide Revenue: $85.4 million
- U.S. Employees: 300
20. Burke
- Founded: 1931
- 2017 U.S. Revenue: $67.3 million
- Percent Change from 2016: -5.3%
- 2017 Non-U.S. Revenue: $7.9 million
- Percent from Outside U.S.: 10.5%
- 2017 Worldwide Revenue: $75.2 million
- U.S. Employees: 263
- Founded: 1938
- 2017 U.S. Revenue: $67 million
- Percent Change from 2016: -12.1%
- 2017 Non-U.S. Revenue: $36 million
- Percent from Outside U.S.: 35%
- 2017 Worldwide Revenue: $103 million
- U.S. Employees: 231
22. Market Strategies International
- Founded: 1989
- 2017 U.S. Revenue: $65.1 million
- Percent Change from 2016: +1.2%
- 2017 Non-U.S. Revenue: $0.9 million
- Percent from Outside U.S.: 1.4%
- 2017 Worldwide Revenue: $66 million
- U.S. Employees: 270
23. Convergys Analytics†
- Founded: 1998
- 2017 U.S. Revenue: $63 million
- Percent Change from 2016: +4.7%
- 2017 Non-U.S. Revenue: $8 million
- Percent from Outside U.S.: 11.3%
- 2017 Worldwide Revenue: $71 million
- U.S. Employees: 710
24. YouGov*
- Founded: 2000
- 2017 U.S. Revenue: $56.3 million
- Percent Change from 2016: +21.6%
- 2017 Non-U.S. Revenue: $87.3 million
- Percent from Outside U.S.: 60.8%
- 2017 Worldwide Revenue: $143.6 million
- U.S. Employees: 182
25. The Macromill Group* †
- Founded: 2000
- 2017 U.S. Revenue: $49 million
- Percent Change from 2016: +8.9%
- 2017 Non-U.S. Revenue: $281.5 million
- Percent from Outside U.S.: 85.2%
- 2017 Worldwide Revenue: $330.5 million
- U.S. Employees: 275
26. Morpace
- Founded: 1975
- 2017 U.S. Revenue: $48.8 million
- Percent Change from 2016: -12.2%
- 2017 Non-U.S. Revenue: $5.5 million
- Percent from Outside U.S.: 10.1%
- 2017 Worldwide Revenue: $54.3 million
- U.S. Employees: 210
27. Market Force†
- Founded: 2005
- 2017 U.S. Revenue: $48 million
- Percent Change from 2016: —
- 2017 Non-U.S. Revenue: $7 million
- Percent from Outside U.S.: 12.7%
- 2017 Worldwide Revenue: $55 million
- U.S. Employees: 300
28. PRS IN VIVO*
- Founded: 1972
- 2017 U.S. Revenue: $46 million
- Percent Change from 2016: -4.2%
- 2017 Non-U.S. Revenue: $47 million
- Percent from Outside U.S.: 50.5%
- 2017 Worldwide Revenue: $93 million
- U.S. Employees: 172
- Founded: 1988
- 2017 U.S. Revenue: $43.9 million
- Percent Change from 2016: -2.4%
- 2017 Non-U.S. Revenue: —
- Percent from Outside U.S.: —
- 2017 Worldwide Revenue: $43.9 million
- U.S. Employees: 144
30. Hanover Research
- Founded: 2003
- 2017 U.S. Revenue: $42.5 million
- Percent Change from 2016: +7.3%
- 2017 Non-U.S. Revenue: $2.4 million
- Percent from Outside U.S.: 5.3%
- 2017 Worldwide Revenue: $44.9 million
- U.S. Employees: 332
31. FocusVision†
- Founded: 1990
- 2017 U.S. Revenue: $39.5 million
- Percent Change from 2016: +2.9%
- 2017 Non-U.S. Revenue: $11 million
- Percent from Outside U.S.: 21.8%
- 2017 Worldwide Revenue: $50.5 million
- U.S. Employees: 353
32. Phoenix Marketing International
- Founded: 1999
- 2017 U.S. Revenue: $37.4 million
- Percent Change from 2016: +9.4%
- 2017 Non-U.S. Revenue: $2.8 million
- Percent from Outside U.S.: 7%
- 2017 Worldwide Revenue: $40.2 million
- U.S. Employees: 145
33. SSRS*
- Founded: 1983
- 2017 U.S. Revenue: $36.9 million
- Percent Change from 2016: +33.2%
- 2017 Non-U.S. Revenue: $1.4 million
- Percent from Outside U.S.: 3.7%
- 2017 Worldwide Revenue: $38.3 million
- U.S. Employees: 181
34. Cello Health plc* †
- Founded: 2004
- 2017 U.S. Revenue: $36.5 million
- Percent Change from 2016: +14.8%
- 2017 Non-U.S. Revenue: $94.8 million
- Percent from Outside U.S.: 72.2%
- 2017 Worldwide Revenue: $131.3 million
- U.S. Employees: 260
35. Radius GMR
- Founded: 1960
- 2017 U.S. Revenue: $34 million
- Percent Change from 2016: +3%
- 2017 Non-U.S. Revenue: $1 million
- Percent from Outside U.S.: 2.9%
- 2017 Worldwide Revenue: $35 million
- U.S. Employees: 97
36. Fors Marsh Group*
- Founded: 2002
- 2017 U.S. Revenue: $32.8 million
- Percent Change from 2016: +6.5%
- 2017 Non-U.S. Revenue: —
- Percent from Outside U.S.: —
- 2017 Worldwide Revenue: $32.8 million
- U.S. Employees: 175
37. Maru/Matchbox
- Founded: 2016
- 2017 U.S. Revenue: $32 million
- Percent Change from 2016: +5.3%
- 2017 Non-U.S. Revenue: $10 million
- Percent from Outside U.S.: 23.8%
- 2017 Worldwide Revenue: $42 million
- U.S. Employees: 69
- Founded: 1983
- 2017 U.S. Revenue: $31.9 million
- Percent Change from 2016: -8.3%
- 2017 Non-U.S. Revenue: —
- Percent from Outside U.S.: —
- 2017 Worldwide Revenue: $31.9 million
- U.S. Employees: 135
- Founded: 1981
- 2017 U.S. Revenue: $30.7 million
- Percent Change from 2016: -22.3%
- 2017 Non-U.S. Revenue: $6.2 million
- Percent from Outside U.S.: 16.8%
- 2017 Worldwide Revenue: $36.9 million
- U.S. Employees: 340
40. Kelton Global
- Founded: 2003
- 2017 U.S. Revenue: $27.2 million
- Percent Change from 2016: +3.8%
- 2017 Non-U.S. Revenue: $7.2 million
- Percent from Outside U.S.: 20.9%
- 2017 Worldwide Revenue: $34.4 million
- U.S. Employees: 94
- Founded: 2010
- 2017 U.S. Revenue: $26 million
- Percent Change from 2016: +18.2%
- 2017 Non-U.S. Revenue: —
- Percent from Outside U.S.: —
- 2017 Worldwide Revenue: $26 million
- U.S. Employees: 83
42. Gongos
- Founded: 1991
- 2017 U.S. Revenue: $24.6 million
- Percent Change from 2016: +16.6%
- 2017 Non-U.S. Revenue: $1.7 million
- Percent from Outside U.S.: 6.5%
- 2017 Worldwide Revenue: $26.3 million
- U.S. Employees: 133
43. The Link Group
- Founded: 1994
- 2017 U.S. Revenue: $24 million
- Percent Change from 2016: -9.1%
- 2017 Non-U.S. Revenue: $0.5 million
- Percent from Outside U.S.: 2%
- 2017 Worldwide Revenue: $24.5 million
- U.S. Employees: 75
44. NAXION†
- Founded: 1911
- 2017 U.S. Revenue: $21.8 million
- Percent Change from 2016: —
- 2017 Non-U.S. Revenue: —
- Percent from Outside U.S.: —
- 2017 Worldwide Revenue: $21.8 million
- U.S. Employees: 76
45. Bellomy Research
- Founded: 1976
- 2017 U.S. Revenue: $19.7 million
- Percent Change from 2016: -0.5%
- 2017 Non-U.S. Revenue: —
- Percent from Outside U.S.: —
- 2017 Worldwide Revenue: $19.7 million
- U.S. Employees: 125
- Founded: 1984
- 2017 U.S. Revenue: $19.7 million
- Percent Change from 2016: +4.8%
- 2017 Non-U.S. Revenue: —
- Percent from Outside U.S.: —
- 2017 Worldwide Revenue: $19.7 million
- U.S. Employees: 75
- Founded: 1999
- 2017 U.S. Revenue: $18.7 million
- Percent Change from 2016: +28.1%
- 2017 Non-U.S. Revenue: $9.1 million
- Percent from Outside U.S.: 32.7%
- 2017 Worldwide Revenue: $27.8 million
- U.S. Employees: 116
48. Hypothesis
- Founded: 2000
- 2017 U.S. Revenue: $18.5 million
- Percent Change from 2016: +4.5%
- 2017 Non-U.S. Revenue: —
- Percent from Outside U.S.: —
- 2017 Worldwide Revenue: $18.5 million
- U.S. Employees: 48
49. KS&R (Knowledge Systems & Research)
- Founded: 1983
- 2017 U.S. Revenue: $16.9 million
- Percent Change from 2016: -11.1%
- 2017 Non-U.S. Revenue: $1.4 million
- Percent from Outside U.S.: 7.7%
- 2017 Worldwide Revenue: $18.3 million
- U.S. Employees: 88
50. RTi Research
- Founded: 1979
- 2017 U.S. Revenue: $14.5 million
- Percent Change from 2016: -14.7%
- 2017 Non-U.S. Revenue: —
- Percent from Outside U.S.: —
- 2017 Worldwide Revenue: $14.5 million
- U.S. Employees: 54
† Some or all figures are not made available by this company, so figures are based on research and estimation by the report author.
* Percent change calculation reflects adjustment of previously reported 2016 U.S. research revenue due to acquisition/divestiture activity or other business change during 2017.
www.ama.org
By : Diane Bowers